





Choose Your Country or Region
Select a different country or region to view content tailored to your location.


Stefan is a financial writer and Forex trading enthusiast with over a decade of experience in finance and technology. His interest in geopolitics, big data, and market sentiment drives his analysis of global market trends, with unbiased, well-researched content to help traders navigate the markets confidently.

Charts, Volume and Time Comparisons
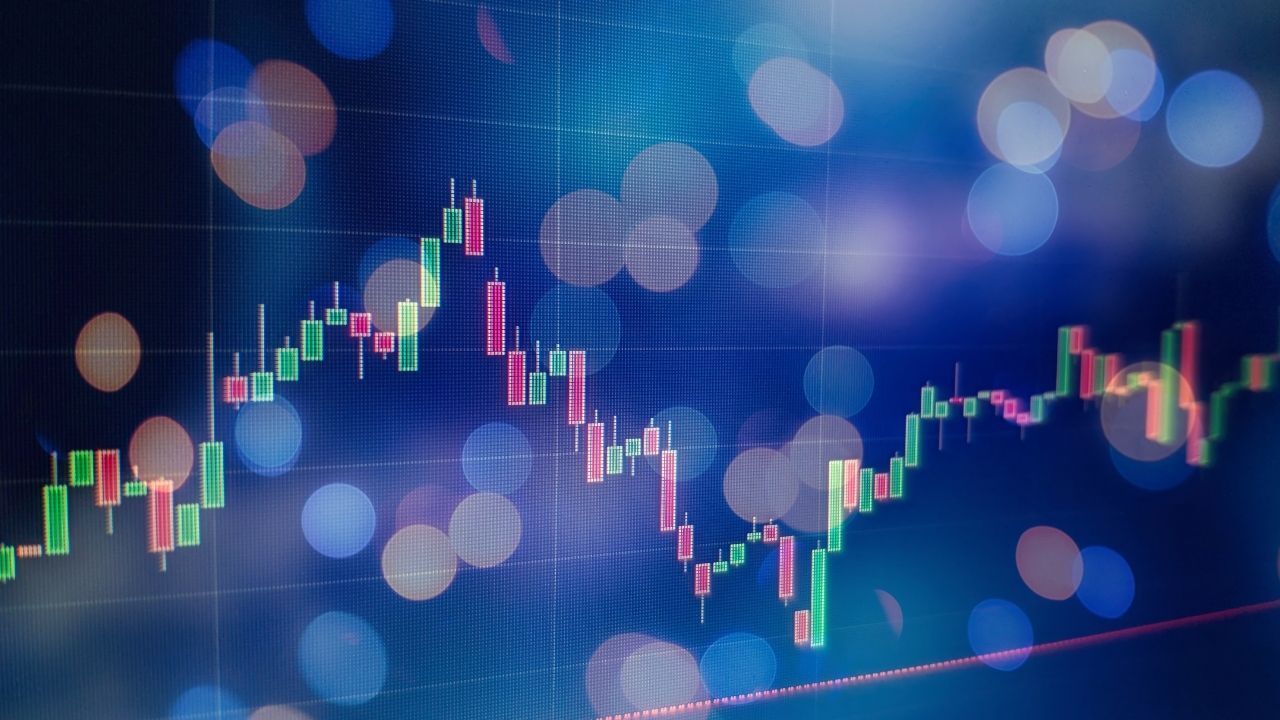
Professional traders read Forex charts in order to find price patterns and remove any guessing from predicting future market movements. The chart patterns become a map that dictates how to trade, and a trader need only follow what the charts are telling them to do. Technical traders don't try to predict what will happen to the market, but instead, react to what is currently happening in the chart data.
Chart Types
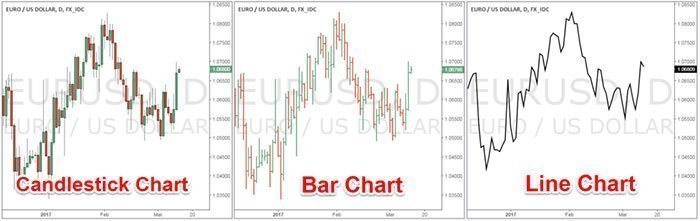
The most popular forex charts are the bar charts, candlestick charts, and line charts. These are simple illustrations to demonstrate the main differences between them.
Example: Bar Charts
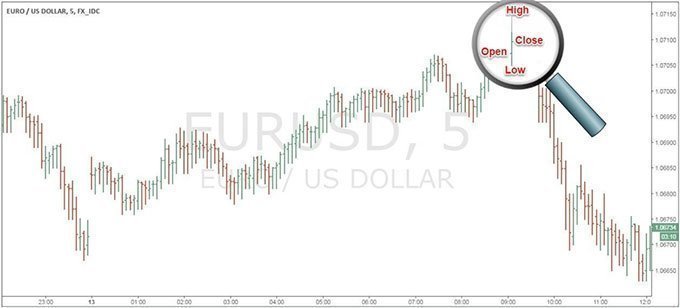
Bar charts are widespread charting method, where all currency pair price information for any single day is shown on a vertical line. The first price on a bar chart is the opening price and it’s marked as a little node on the left of the bar. The closing price is marked as a second node on the right of the bar. The ceiling the price reached during the day is the high price, and the price floor or the low price is also shown.
Analyzing Charts
The patterns these charts display are a summary of all the activity, from all market participants, and give a trader insight into the collective market psychology. It is the interactions between the buyers and sellers that generate volatility, and studying the charts help identify the best moments to buy or to sell currency pairs.
Overlaying technical analysis tools on charts help predict future price action, and give insight into the market direction and the strength of the trends.
Volume Analysis
Total volume is the sum of all orders on the market - both buying and selling. If there are more traders buying than selling, the value of the currency will increase, but if there is more selling than buying the value of the currency will decrease.
If the current price is rising but volume is decreasing, this can be an early sign that the trend is losing momentum and could reverse, and the same holds true if it the currency price is falling, but volume is decreasing.
Time Comparisons
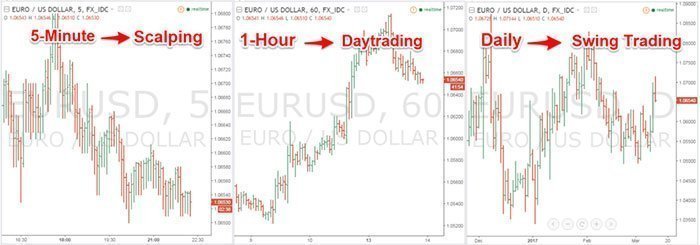
There are a number of set time frames used in charting the Forex market. All Forex trading platforms offer charts starting from the 1-minute chart, to the weekly chart, and even monthly charts. Higher time frames, such as the daily chart, provide a better perspective for analyzing support and resistance levels, but each of the time frames has advantages and disadvantages for different types of trader.
- Scalpers use the 1 minute and 5-minute charts. The 5-minute chart will help you to hold your winners for longer than the 1-minute chart because you have a more macro perspective.
- Day traders use short time frame charts like the 15-minute chart and 1-hour chart to capture the small trends.
- Swing traders use longer time frames like the daily chart to capture the larger trends.
Others Also Viewed
Explore more resources that fellow traders find helpful! Check out these other guides to enhance your forex trading knowledge and skills. Whether you’re searching for the best brokers, educational material, or something more specific, we’ve got you covered.

Best Brokers in the Philippines
Discover the top Forex brokers in the Philippines. Compare top platforms, fees and features to make an informed trading choice.

How does Forex Trading Work?
What is Forex trading and how does it work? An easy-to-read guide including how to trade, and how to choose a reliable broker.

Forex Brokers for Beginners
Explore the best Forex brokers for beginners in the Philippines with user-friendly platforms, educational resources, and demo accounts.
Meet the Experts Behind Our Unbiased Reviews
Chris Cammack
Partner Manager and Financial Writer

Alison Heyerdahl
Head of Content
Stefan de Clerk
Financial Writer