
Compare Forex Brokers!
Compare top Forex brokers side-by-side and find the best fit for your trading needs. Start your comparison now!


This article explains the factors you need to consider when placing a trade and the terminology behind them.
We will look at
By the time you finish reading this piece, you will be able to place a well-thought-out trade.
The trading approach you follow will influence your choice of currency pairs. But besides that, many people focus most of their attention on the pairs traded in large volumes, for example, the major currency pairs. These pairs have low spreads, and because of their dense liquidity and high trading volumes, technical analysis can often be more accurate on these pairs than on exotic currency pairs, for example.
Significant slippage is also less likely when trading major currency pairs because of their high liquidity and trading volume. Here are the 7 major currency pairs:
Maybe you’ve learnt about trading in the direction of prevailing trends (which is one of the most important aspects of trading). In this case, you need to identify a currency pair exhibiting strong trending behaviour and ignore the pairs stuck in ranges.
Perhaps you have a range trading strategy in mind. Well, then, you need to select a currency pair that is currently trading in a range.
If you choose to only trade currency pairs with very low spreads (like the majors), you will surely miss out on superb trading opportunities from time to time. Nevertheless, there are successful traders who focus only on major pairs.
Not all currency pairs have the same spreads. As mentioned already, the major currency pairs generally have low spreads. However, the spread is not all you need to consider. You also need to examine how much a currency pair can move in a certain amount of time. You see, some currency pairs have wider spreads than the major pairs, but their average price movements over a certain period of time can be much larger than those of the major currency pairs.
A good example is the GBP/JPY (Great British pound/Japanese yen), with a spread about twice as wide as the EUR/USD. A beginner may think it isn’t worth trading the GBP/JPY because of its relatively wide spread. However, this pair can produce much larger price movements than the EUR/USD over the same period of time. So, if the GBP/JPY happens to throw a really strong trend at you, it surely makes sense to catch that trend.
This is a really important matter. You need to have an idea of how much the market needs to move to cover your trading fees. You see, if you have a small profit target in pips, like for example 10 pips, your transaction costs are actually very high in relation to your target. If you’re paying a spread of 2 pips, for example, it is 20% of your profit target, which is really high.
Did you know that with a spread of 2 pips, you need the market to move 12 pips to hit a profit target of 10 pips? At the same time, the market only needs to move 8 pips to hit a stop loss of 10 pips. Now compare 12 pips to 8 pips… that’s quite a big difference. The distance to your take profit is 50% further than the distance to your stop loss.
We strongly recommend trading on charts that display both the bid and ask price lines. This makes the spread visual to you and gives you a good feel of its impact on your trading. Here is a screenshot of an MT4 chart with the bid and ask price lines plotted on it:
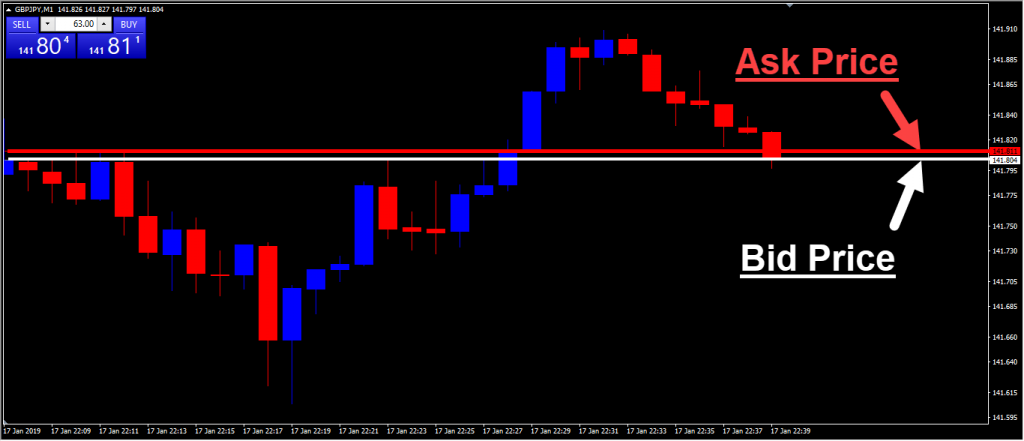
This screenshot was taken from a Pepperstone Razor MT4 trading platform. Because the spread is so thin with a Razor account, we had to open a 1-minute chart for the spread to be clearly visible.
With a Pepperstone Razor trading account, you pay the raw interbank spread plus a small commission, which is usually less than 1 pip. In this case, the spread on the GBP/JPY was 0.7 pips plus a commission of roughly 1 pip. So, the total transaction cost amounts to 1.7 pips.
With the GBP/JPY, the average range of a 1-minute candlestick is about 3.5 pips. So, you could easily cover your trading costs in less than a minute if the price moves in your favour. Of course, we’re not considering rollover fees in this example. But if you plan on keeping trades overnight, you may incur rollover charges, depending on which pairs you trade. With some pairs, you will actually earn interest when you hold them overnight.
If you’re unsure how to plot the bid and ask prices on your MT4 charts, look at our guide to MT4 and follow the 4 easy steps.
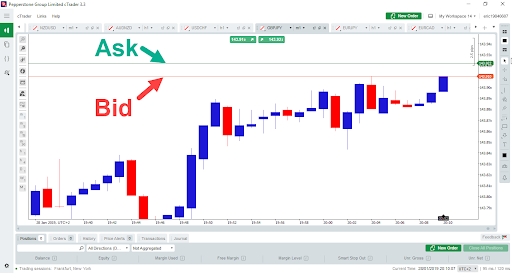
Alternatively, you can open a cTrader trading account with FxPro or Pepperstone. cTrader is an institutional-grade trading platform that automatically displays both the bid and ask prices on its charts. By the way, cTrader is great for beginners, especially because it is easy to place and modify trades. It is also more advanced than MT4 and boasts superior features.
If you get this wrong, you can easily blow your trading account! First, you must know how much capital you want to risk per trade. It is recommended to risk less than 2% of your entire trading account per trade.
For this example, let’s say you have a $1,000 trading account and are willing to risk no more than 1% per trade. This means that you can risk up to $10 per trade. But how can we calculate the trade’s lot size to fit a $10 stop loss into a certain number of pips?
To do this, you obviously need to know the pip value of the currency pair you’re trading. Suppose you have a trading account with a U.S. dollar base currency. With the following pairs, you needn’t make any calculations because they all have a pip value of $10 per standard lot:
| | GBP/USD | EUR/USD | AUD/USD | NZD/USD |
|---|---|---|---|---|
| 1 Lot (100,000) | $10 per pip | $10 per pip | $10 per pip | $10 per pip |
| 0.1 Lots (10,000) | $1 per pip | $1 per pip | $1 per pip | $1 per pip |
| 0.01 Lots (1,000) | $0.10 per pip | $0.10 per pip | $0.10 per pip | $0.10 per pip |
In each of these currency pairs, the U.S. dollar is the quote currency (the currency after the ‘slash’. With these pairs, a pip is 0.0001 in decimal form. Multiply 0.0001 by the notional value of the trade to get the dollar value of one pip. For example, if you place a trade of 0.01 lots (1 micro lot), the notional size is 1000 units of the currency pair. Multiply 0.0001 by 1000, and you get a pip value of $0.10.
With pairs where the U.S. dollar isn’t the quote currency, the pip value is first calculated and expressed in the quote currency of that pair. If the quote currency of the pair is not the same as your trading account’s base currency, the value is then divided by the appropriate exchange rate to derive a pip value denominated in your trading account’s base currency.
Here is an example of calculating the pip value of the USD/JPY. If your trading account’s base currency is Japanese yen, the pip value is always the same. If you’re trading micro lots, it is 10 yen per pip.
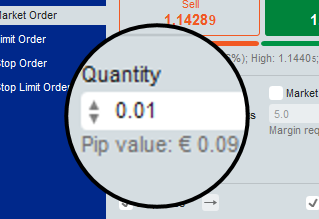
If your account base currency is the U.S. dollar, the pip value is still 10 yen, but you need to convert that to USD. Let’s say the current exchange rate is 111.111 yen per USD. Divide the pip value of 10 yen by the exchange rate of 111.111 to get a pip value of $0.09 per micro lot.
Let’s say the USD/JPY exchange rate moved lower to 100.00. In that case, the pip value would be $0.10. (10 yen divided by 100.00). With this example, you can see that the pip values of some currency pairs are not constant and need to be calculated if you want to know exactly what the pip value is at the time of placing your trade.
Now that you know how to calculate pip values, the rest is pretty simple. Let’s say you’re looking at a trade setup on the EUR/USD which requires a stop loss of 50 pips. As you just saw in the table above, the pip value of the EUR/USD is always $0.10 if you’re trading a micro lot (1000 units).
Remember, we want to risk no more than $10 on the trade, and we’re using a 50-pip stop loss. When trading a micro lot, a 50-pip stop loss is $5. (50 pips multiplied by the pip value of $0.10 equals $5).
Next, we need to divide the amount we’re willing to risk ($10) by the value of our stop loss calculated at one micro lot ($5) to get our lot size of 2 micro lots. Not very difficult, is it?
*Pip Value Tips:
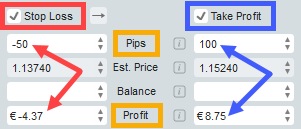
Here you can also enter your stop loss and take profit distances in pips, which will automatically calculate its dollar (or other base currency) values:
First of all, there are two directions in which you can trade - long (buy) and short (sell). Long positions make money when the price moves higher and short positions make money when the price declines.
Unlike short positions on stock CFDs, short positions on currency pairs do not carry unlimited risk. In fact, short forex trades carry the same amount of risk as long trades.
When a short (sell) position is opened on a currency pair, a take profit order is usually placed below the entry price. A stop loss can be placed above the entry price.
Technical and fundamental analysis can often give you a good idea of where the market is likely to head and whether large or small market movements can be expected. For beginners, technical analysis is usually a more objective and practical way to assess the current market situation.
For example, a beginner may not possess the skill to accurately analyse U.S. labour market numbers, monetary policy decisions, GDP numbers, etc. However, with a little bit of training, an inexperienced trader will recognise trending behaviour and discern between impulsive and corrective price action. This brings us to one of the MOST IMPORTANT things about trading...
Trading in the direction of strong trends gives you the best chance to make money in the forex market. The larger time frames (e.g. the weekly and daily) are usually the best to focus on when looking for predominant trends.
Smaller time frames like for example, the 4-hour and 1-hour can be used to fine-tune your trade entries which should be aligned with strong trends and impulsive moves on the higher time frames. Of course, there is money to be made with counter-trend trading, but it requires a lot of skill and mostly exposes you to more risk and smaller rewards.
Below is a good example of a powerful uptrend on a daily chart of the GBP/JPY. Notice how the 13-EMA, 50-EMA, 100-EMA, and 200-EMA are diverging from each other and also sloping upwards. Besides that, we can see that the price is above the 13-EMA most of the time. In this chart, the price is forming higher swing highs as well as higher swing lows. The bullish price waves are mostly impulsive while the bearish waves are mostly corrective in nature. Looks like a good trend to buy into!
*EMA stands for exponential moving average. This type of moving average place more weight on the most recent price action. It is therefore more reactive to price action than simple moving averages (SMAs). With any trading platform, you can choose between EMAs, SMAs, and even some other types of moving averages.
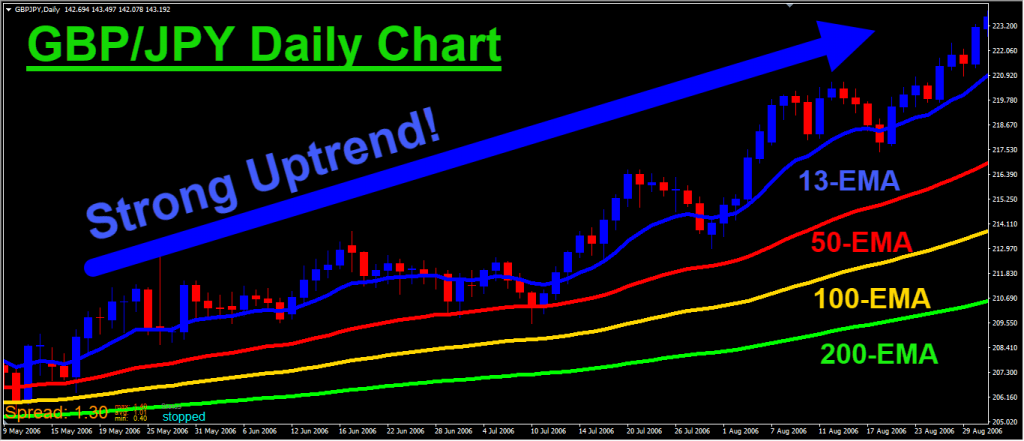
In a strong uptrend, rule of thumb is to be bullish.

Crocs are patient hunters who don’t waste energy on chasing their prey all day long. These creatures can sometimes wait days for the perfect opportunity to capture their victims.
New forex traders are often very impatient. Instead of strategically ‘lying in ambush’, they chase the market and snap at anything that almost looks like a good trade setup. Instead of taking high-probability trades only, they waste precious time, focus, and capital on low-probability setups.
Executing a trading plan with fine-tuned trade entries magnifies your chances of success over the long run. You will miss out on profitable trades from time to time, but your overall performance will be better, provided that you have a solid trading strategy that deploys a definite edge.
The first steps in risk management are to use the correct lot size, risk a small amount of capital per trade, avoid overtrading, and apply high-probability trading strategies.
An important component of risk management is to exit losing trades at an optimal level. This should ideally be done with an automatic order called a stop loss. Let’s look at the different types of stop loss orders and how to use them correctly.
Risk management is extremely important when it comes to trading. This is especially true with margin trading accounts that allow you to trade with leverage. A single leveraged trade can wipe out your entire trading account if you use the wrong lot size and/or don’t use a stop loss.
Any forex trading platform allows you to attach stop loss orders to your trades. While you don’t always need to use a take profit order, it is highly recommended to always use a stop loss. Some institutions and experienced traders trade without stop losses but usually do so with very low leverage (if any) and large amounts of capital.
The safest way to apply a stop loss is to set it before you open your trade. You never know what could happen after you’ve opened the trade. You could experience a problem with your internet connection; your broker’s system could go down just after you’ve placed the trade; an emergency could arise forcing you to abandon your pc; your pc could shut down unexpectedly, etc.
Static stop loss orders are captured and stored on your broker’s server. This means that even though your trading platform isn’t running on your computer or if your internet connection is down, your broker’s server will automatically execute your stop loss, if necessary.
A trailing stop loss can sometimes increase the profitability of a trading strategy considerably, while at the same time reducing its drawdown. On the other hand, it can also reduce profits and increase the drawdown if it’s applied to the ‘wrong’ strategy.
A trailing stop loss can be set at a certain distance from the current market price, for example, 100 pips. So, if you open a buy trade with a 100-pip trailing stop loss, the stop loss will never be further away from the current market price than 100 pips. If the price moves higher, the trailing stop loss will move higher at the same rate as the price.
But when the price moves lower, the trailing stop loss remains at the same level; it cannot move lower. When the price moves above the level where the trailing stop loss was last modified, it will be modified again and continue to lock in your profits or at least reduce the amount you can lose on the trade.
For example, with a buy trade with a trailing stop loss of 100 pips, a bullish price movement of 110 pips will cause the stop loss to be trailed all the way past the entry price and lock in a profit of 10 pips. Then, if the price happened to reverse all the way back to the entry price, the trader would still end up with a 10-pip gain because the trailing stop loss was locked at the entry price plus 10 pips.
Here is an example of how a trailing stop loss improved an automated strategy’s performance:
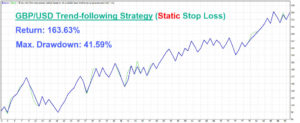
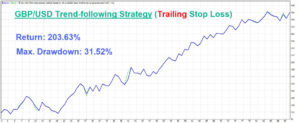
As you can see from these screenshots, this trading strategy performed much better with a trailing stop loss than with a static stop loss. Not only was the return higher, but the drawdown was also smaller.
With any forex trading platform, you can attach a trailing stop loss to your trades. However, if you use MT4, you need to keep your trading platform open, logged in, and connected to the internet for the trailing stop to work. The trailing stop is controlled from your computer.
With cTrader, however, you have access to a server-side trailing stop loss, which means that your trailing stop loss will work correctly, even if your computer is not connected to your broker’s server.
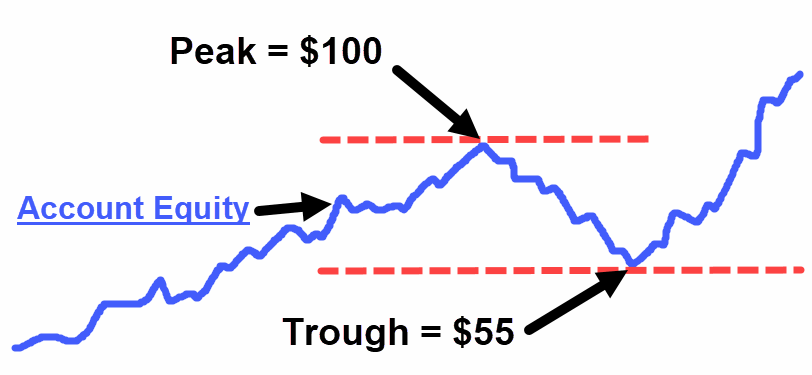
*Maximum drawdown is the largest loss from a peak to a trough during a certain period of time. For example, a trading account grows steadily to $100 with a few minor capital drawdowns. Then, it declines from $100 all the way to $55, after which it quickly moves past $100 again. In this case, the maximum drawdown is $45, which is 45%. Look at this picture:
*The return on an investment is the percentage gained or the dollar amount gained during a certain period of time. For example, our ‘trailing stop loss’ example started out with $100 capital and made an additional $203.63. So, $203.63 divided by $100, is 2.0363. Multiply this by 100 to get the percentage gained, which is 203.63%.
This depends on your trading strategy or trading approach. Some traders like using really tight stops while others place their stops at a ‘safe’ distance which is not easily reached. Here are a few different approaches:
When you place a stop loss, you need to be reasonable and consider the ratio between your stop loss and take profit. A good risk-to-reward ratio could boost your profitability but if it’s too high, it may be too extreme to work well with your trading strategy.
You see, if you use really tight stops with extremely wide targets, you could have a very jagged equity curve, with drawdowns beyond your comfort zone. You also stand a good chance of losing money with this type of trading.
A stop loss can often be a hazardous stumbling block lying just before the finish line, so to speak. You need to give your trades a fair chance of winning and at the same time cut your losses when a trade turns sour. Few things can frustrate a forex trader like being stopped out just before the market moves in your favour.
Below is an example of a very rough GBP/USD strategy traded with a 10-pip stop loss and a 100-pip take profit. It follows the trend on the hourly time frame and only trades one position at a time:

With these settings, the strategy lost $250.26 (25.26%) in four years and experienced a maximum drawdown of 27.64%.
Now let’s look at how the same strategy performed with a stop loss of 80 pips and a take profit of 85 pips:

This time, it made a profit of $162.99(16.3%) with a maximum drawdown of 12.34%.
Here we can see that the lower risk-to-reward ratio performed considerably better than the massive 1:10 ratio. One of the most important reasons for this is the wider stops that gave the trades some space to breathe. The stop loss distance of 80 pips is much more suited to this pair’s volatility than a stop loss of 10 pips.
A common mistake made by forex beginners is to think that making money with forex trading is a breeze. The truth is, that a beginner has much to learn about the market. You also need discipline, proper risk management, and a profitable trading approach.
With this in mind, it is wise to first find your feet with a demo account before going live. It will also help you a lot if you can backtest and forward test your strategies before putting your money behind it. Even if you don’t have a trading robot (EA) to backtest with, you can probably do a manual backtest by looking at price history and observing how your strategy would have performed.
Explore more resources that fellow traders find helpful! Check out these other guides to enhance your forex trading knowledge and skills. Whether you’re searching for the best brokers, educational material, or something more specific, we’ve got you covered.